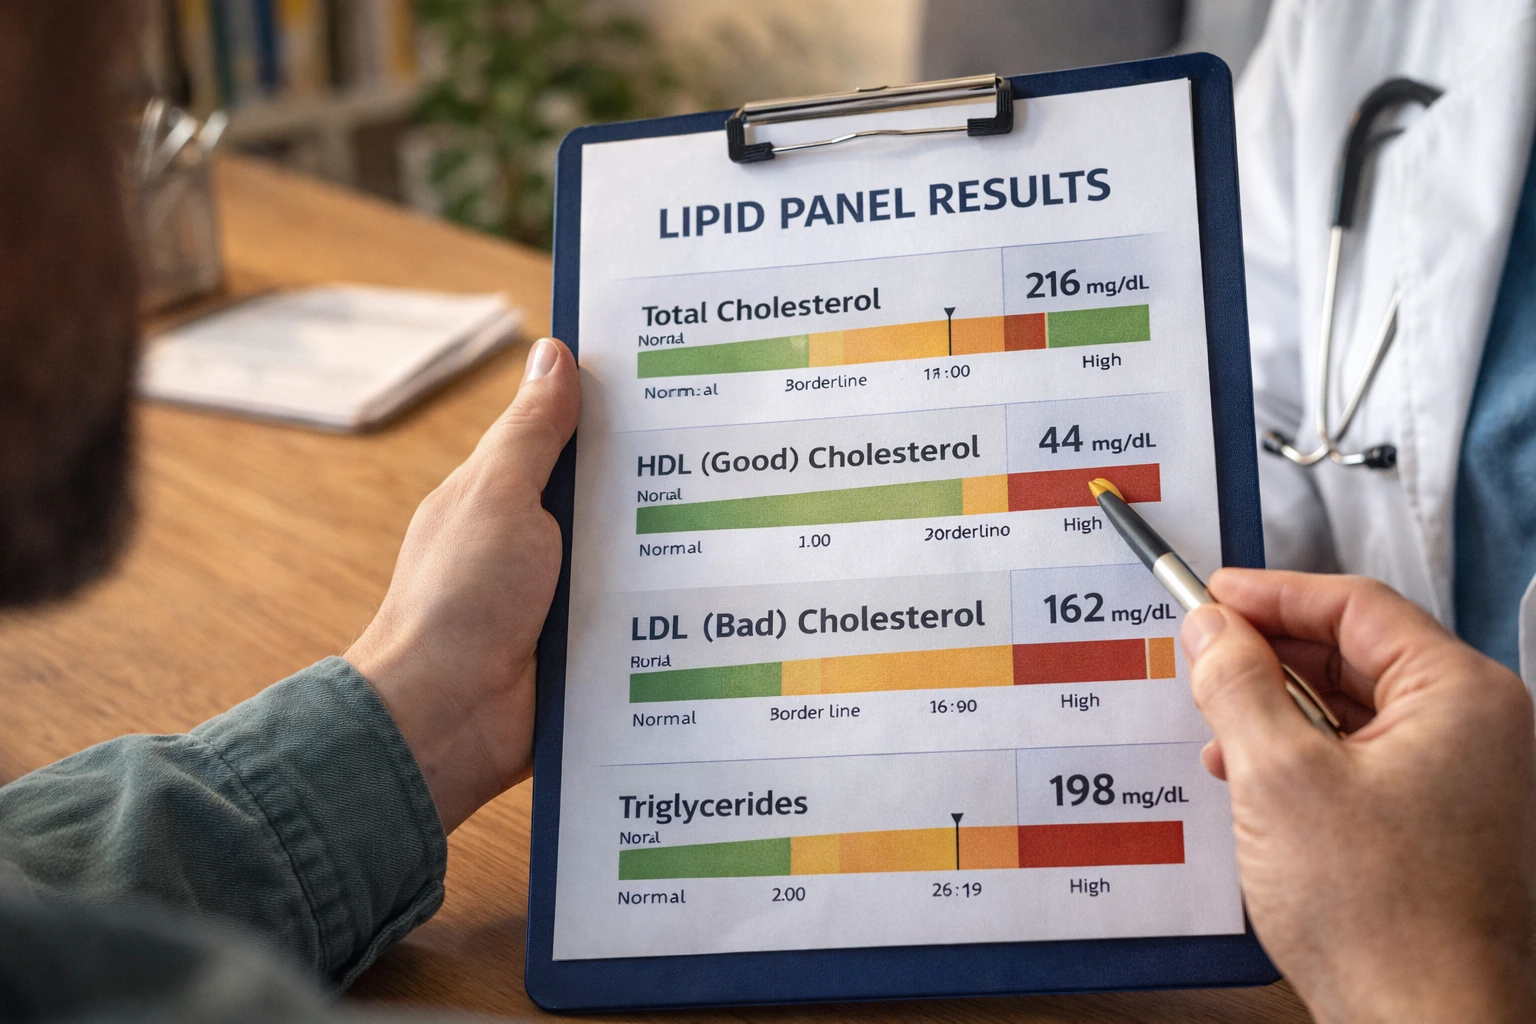
You got your lipid panel results back and stared at the numbers feeling completely lost, wondering if those cholesterol levels mean you’re headed for trouble or if you’re actually fine – lipid panel results explained here so you finally understand what your doctor is actually telling you.
Understanding lipid panel results
Your lipid panel is essentially a snapshot of your cardiovascular health taken through blood work. It breaks down four key measurements that paint a picture of how your body is managing fats and cholesterol. Think of it like a financial statement for your heart – each number tells you something important about your current standing. Total cholesterol adds up all the cholesterol in your blood, while LDL represents the cholesterol particles that can stick to artery walls over time. HDL works like a cleanup crew, actively removing harmful cholesterol. Triglycerides are another fat type that matters. For women specifically, these numbers shift during different life stages – menopause can change your lipid profile significantly, which is why understanding your baseline matters. Your doctor isn’t just looking at isolated numbers; they’re considering your age, family history, and overall health picture to determine what’s actually concerning versus what’s normal for you.
- Total cholesterol measures the combined levels of HDL, LDL, and other lipid components in your blood.
- LDL (low-density lipoprotein) cholesterol is often referred to as ‘bad’ cholesterol that can build up in arteries.
- HDL (high-density lipoprotein) cholesterol is known as ‘good’ cholesterol that helps remove LDL from the arteries.
- Triglycerides are a type of fat that can increase your risk of heart disease when elevated.
- The ideal ranges for these values may vary depending on individual health factors such as age and medical history.
Interpreting your results
Numbers on a lab report can feel abstract until you understand what they actually mean for your life. Imagine Sarah, a 45-year-old woman who got her lipid panel back showing total cholesterol of 210 mg/dL. Without context, that might sound alarming, but her HDL was 65 and her LDL was 120 – actually a fairly healthy profile. The ratio between these numbers matters more than any single figure. Your healthcare provider looks at the whole story: Are you active? Do you have diabetes? Does heart disease run in your family? A woman with no family history and excellent fitness might have different target ranges than someone with multiple risk factors. The key is moving beyond panic and into understanding. Your results aren’t a verdict; they’re data points that help you and your doctor create a plan. Some women find it helpful to ask their doctor to explain not just what the numbers are, but what they mean specifically for their risk level and what the next steps should be.
📘 Fix your day in under 2 minuteschoose where to begin:
Lifestyle modifications
If your lipid panel shows elevated cholesterol, the good news is that lifestyle changes often work remarkably well, sometimes even better than medication alone. Start with your diet – this doesn’t mean deprivation. Focus on adding foods rather than restricting: fatty fish like salmon twice weekly for omega-3s, oats and beans for soluble fiber, nuts and seeds for healthy fats, and plenty of colorful vegetables. Many women find success by swapping refined carbs for whole grains and cooking with olive oil instead of butter. Physical activity is equally powerful; you don’t need intense workouts. Consistent movement like brisk walking 30 minutes most days, swimming, or cycling can meaningfully improve your lipid profile within weeks. Stress management matters too – chronic stress elevates triglycerides and lowers HDL. Consider yoga, meditation, or simply prioritizing sleep. If you smoke, quitting is one of the single most impactful changes you can make. Track your progress by noting how you feel – more energy, better sleep, improved mood – these often precede the number changes on your next lipid panel.
Monitoring your progress
Getting one lipid panel result is just the beginning of your health story. Most doctors recommend retesting every 4 to 6 years for healthy adults, but if you’re making lifestyle changes or have risk factors, you might test every 3 months initially to see if your efforts are working. This frequent feedback can be incredibly motivating – seeing your LDL drop by 15 points after three months of dietary changes proves that your actions matter. Keep a simple log: note your test dates, the four key numbers, and what you were doing differently since the last test. Were you more consistent with exercise? Did you change your diet? This creates a personal data set that shows you what actually moves your numbers. Work with your healthcare provider to set realistic targets based on your individual risk profile, not just generic ranges. Some women benefit from working with a registered dietitian who can personalize nutrition advice. Remember that lipid levels naturally fluctuate slightly based on stress, sleep, and even the time of year, so one slightly elevated result doesn’t mean failure.
Seeking further guidance
Your lipid panel is one tool, but it’s not the whole picture of your heart health. If your results concern you or lifestyle changes aren’t moving the needle after several months, a conversation with your healthcare provider is the next logical step. They might refer you to a cardiologist or lipid specialist, especially if you have a strong family history of heart disease or if you’re a woman over 55 with multiple risk factors. Some women benefit from medication alongside lifestyle changes – statins are well-researched and effective, though they’re not right for everyone. Don’t feel pressured into any treatment without understanding the reasoning. Ask your doctor about your 10-year cardiovascular risk score, which gives you a personalized estimate rather than generic numbers. If you’re in perimenopause or menopause, hormone changes significantly affect lipids, so your doctor might take a different approach than they would for a younger woman. Remember that seeking guidance isn’t admitting defeat; it’s taking your health seriously and getting expert support for the specific situation you’re in.
Your lipid panel results are actionable information, not a judgment. Understanding what your cholesterol numbers mean, making targeted lifestyle changes, monitoring your progress consistently, and working with healthcare professionals creates a complete strategy for heart health. Women’s lipid profiles change throughout life stages, so regular testing and personalized guidance matter more than hitting generic targets.
What are the optimal ranges for cholesterol levels in a lipid panel?
Optimal cholesterol levels can vary, but typically, total cholesterol should be below 200 mg/dL, LDL below 100 mg/dL, HDL above 60 mg/dL, and triglycerides below 150 mg/dL. However, women with existing heart disease or multiple risk factors may have different targets set by their healthcare provider.
How often should I have my lipid panel tested?
For most adults, getting a lipid panel test every four to six years is recommended. However, individuals with existing heart conditions or at higher risk of heart disease may need more frequent testing as advised by their healthcare provider. Women undergoing menopause or taking hormone therapy should discuss testing frequency with their doctor.
Others also read:
Disclaimer: This article is for informational purposes only and is not a substitute for professional medical advice. Always consult a healthcare professional for personal guidance.
This guide has been prepared and reviewed by the GlobalHealthBeacon editorial team and reflects current medical research as of 2026. It provides structured, evidence-based information to support informed health decisions.
