This report and its visuals are free to use in editorial content if you link to this page as the original source. Suggested source attribution: Global Health Beacon – Sleep Industry Report 2026
Sleep health has become one of the fastest-growing areas in global wellness and healthcare. This page compiles the most relevant sleep statistics for 2026, including insomnia prevalence, sleep deprivation trends, recovery data, and sleep industry insights. All statistics are structured for quick reference and citation use
Most Cited Sleep Statistics
- About 30–35% of adults worldwide report insomnia symptoms.
- About 35% of U.S. adults sleep less than seven hours per night.
- Short sleep is linked to higher risk of depression, diabetes, and cardiovascular problems.
- Women report higher rates of sleep difficulty than men, including trouble falling asleep.
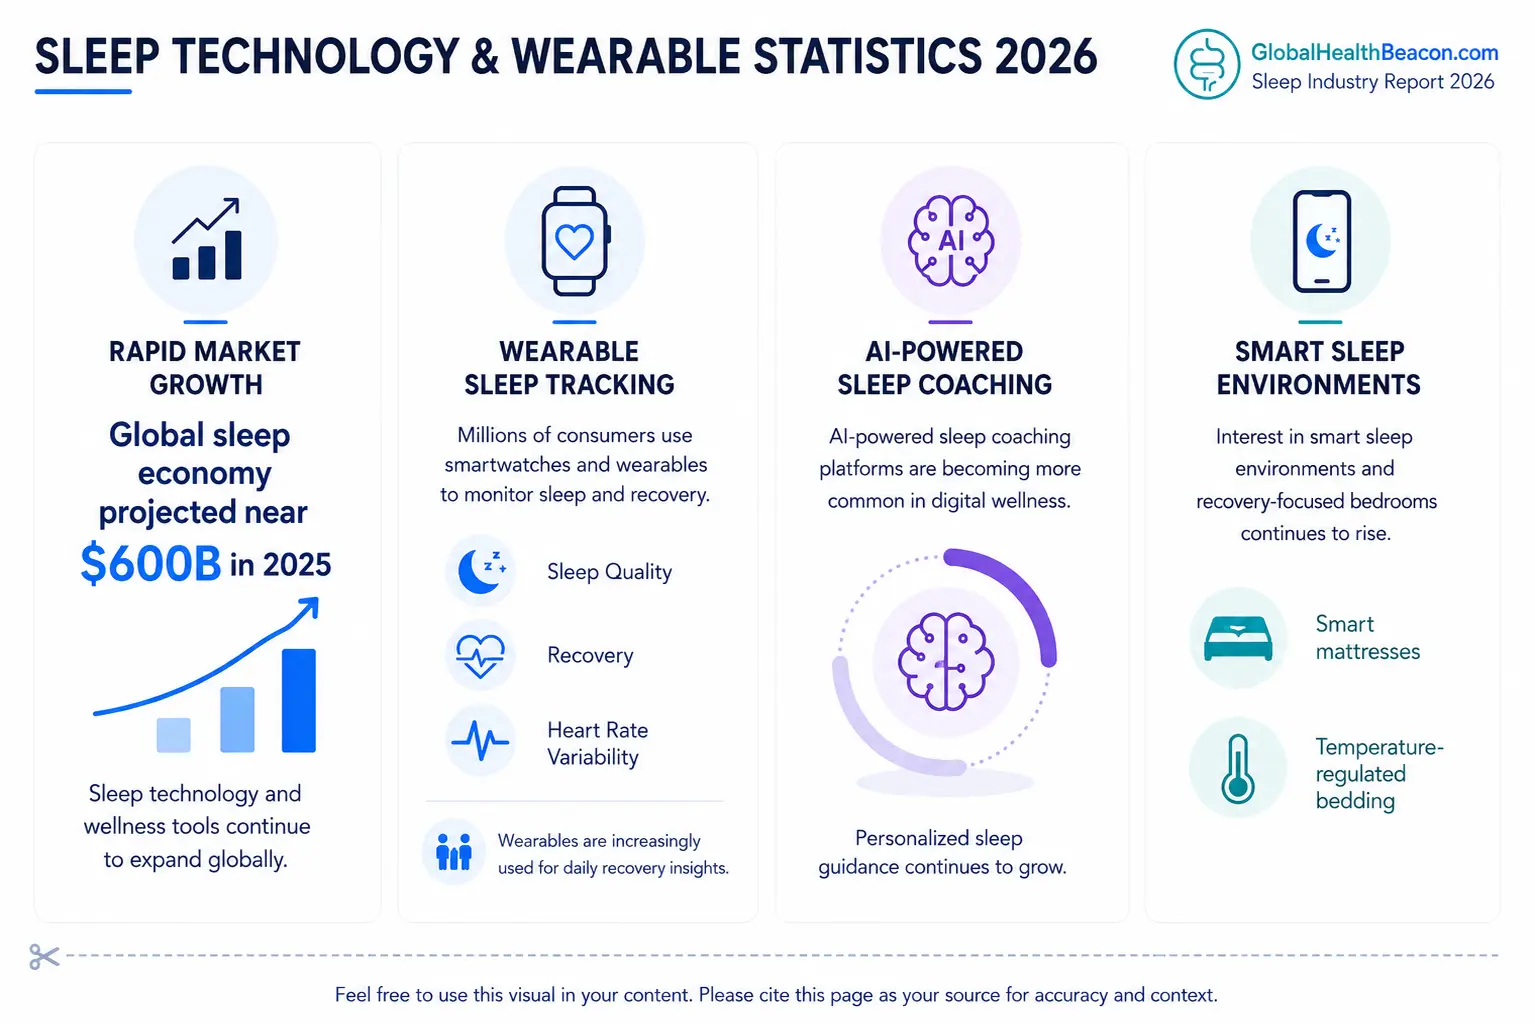
- The global sleep economy is estimated to be worth nearly $600 billion in 2025.
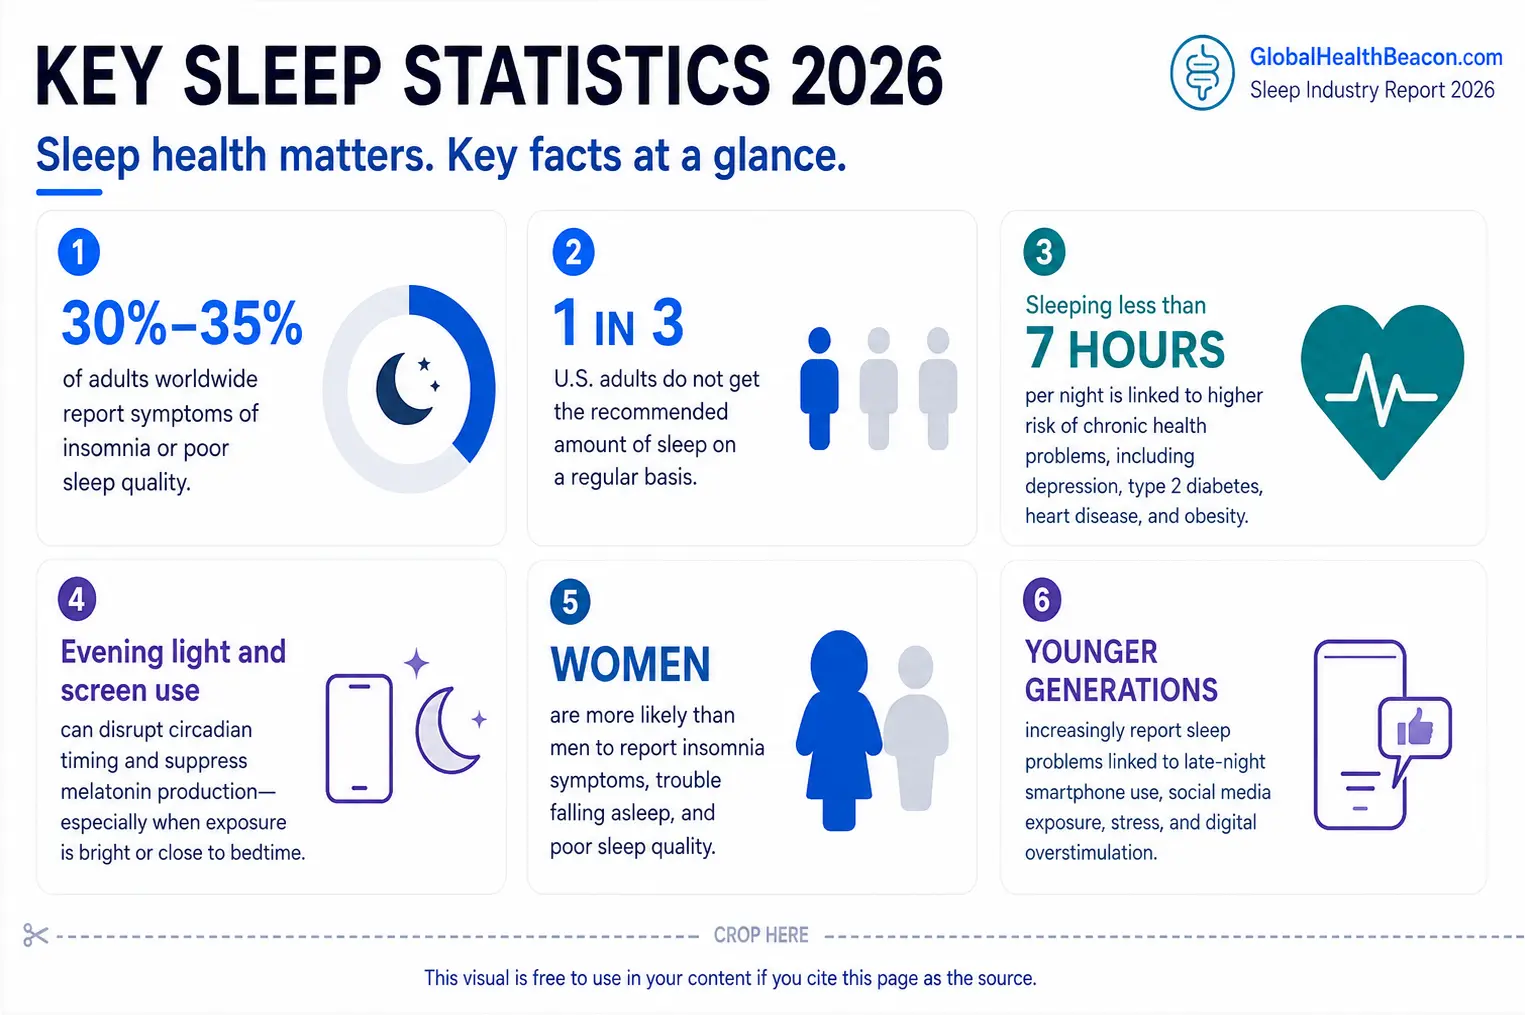
Key Sleep Statistics 2026
- 30%–35% of adults worldwide report symptoms of insomnia or poor sleep quality¹
- More than 1 in 3 U.S. adults do not get the recommended amount of sleep on a regular basis²
- Adults who sleep less than 7 hours per night are more likely to report chronic health problems, including depression, type 2 diabetes, heart disease, and obesity³
- Evening light exposure and screen use can disrupt circadian timing and suppress melatonin production, especially when exposure is bright or close to bedtime⁴
- Women are more likely than men to report insomnia symptoms, trouble falling asleep, and poor sleep quality⁵
- Younger people increasingly report sleep problems linked to late-night smartphone use, social media exposure, stress, and digital overstimulation⁶
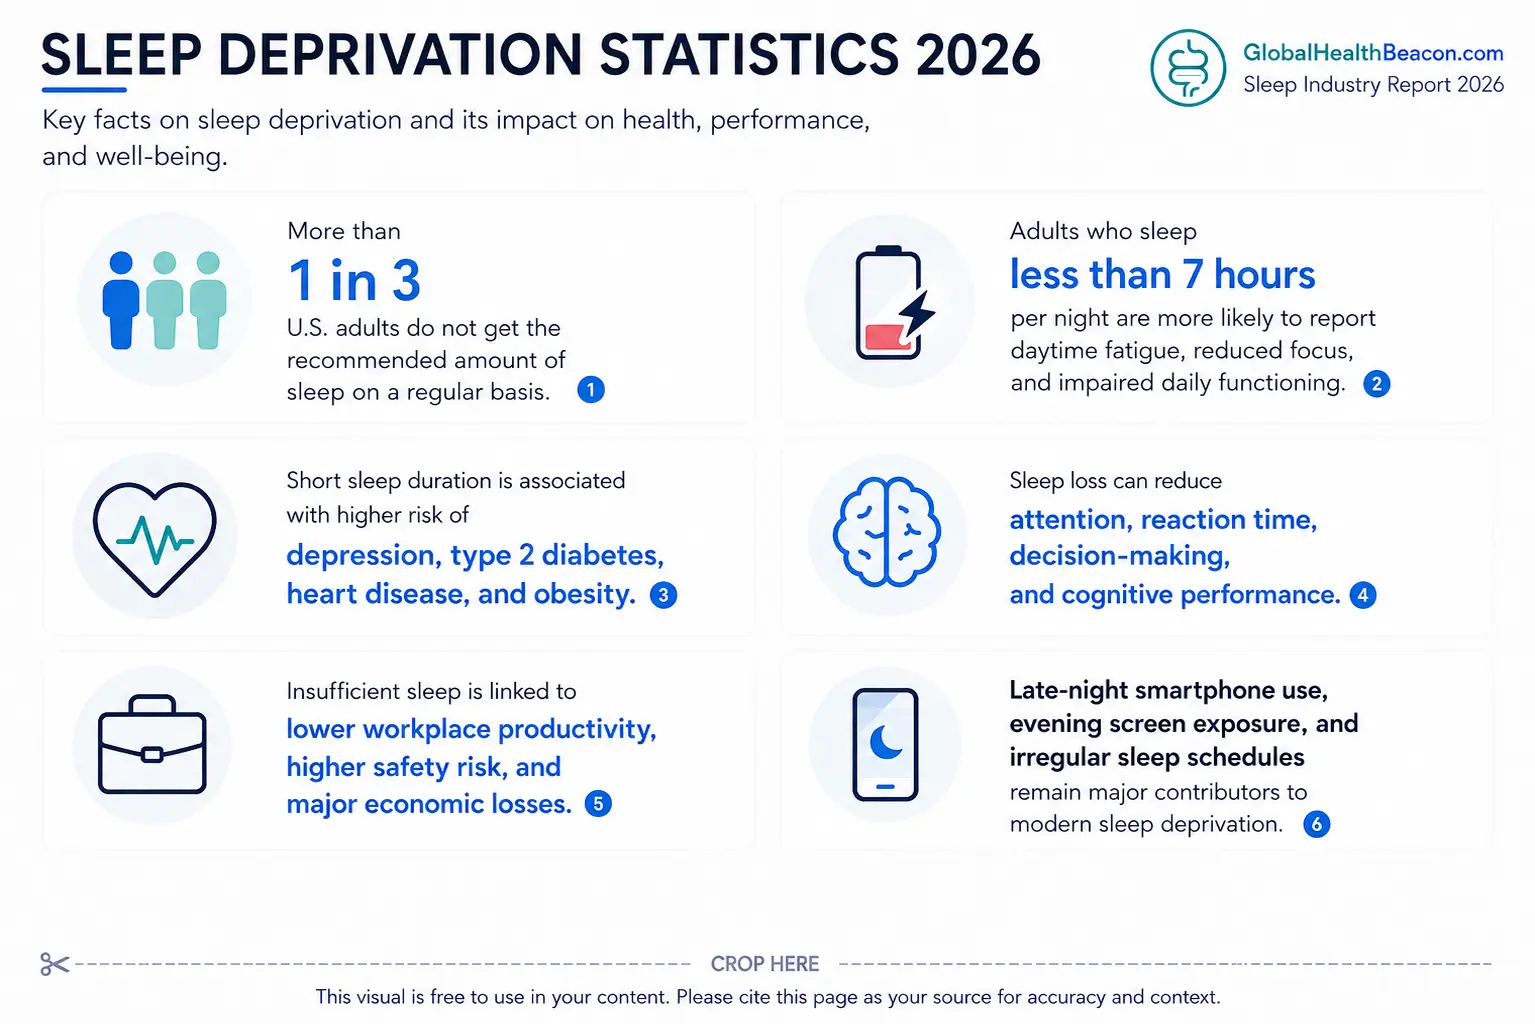
Sleep Deprivation Statistics 2026
- More than 1 in 3 U.S. adults do not get the recommended amount of sleep on a regular basis¹
- Adults who sleep less than 7 hours per night are more likely to report daytime fatigue, reduced focus, and impaired daily functioning²
- Short sleep duration is associated with higher risk of depression, type 2 diabetes, heart disease, and obesity³
- Sleep loss can reduce attention, reaction time, decision-making, and cognitive performance⁴
- Insufficient sleep is linked to lower workplace productivity, higher safety risk, and major economic losses⁵
- Late-night smartphone use, evening screen exposure, and irregular sleep schedules remain major contributors to modern sleep deprivation⁶
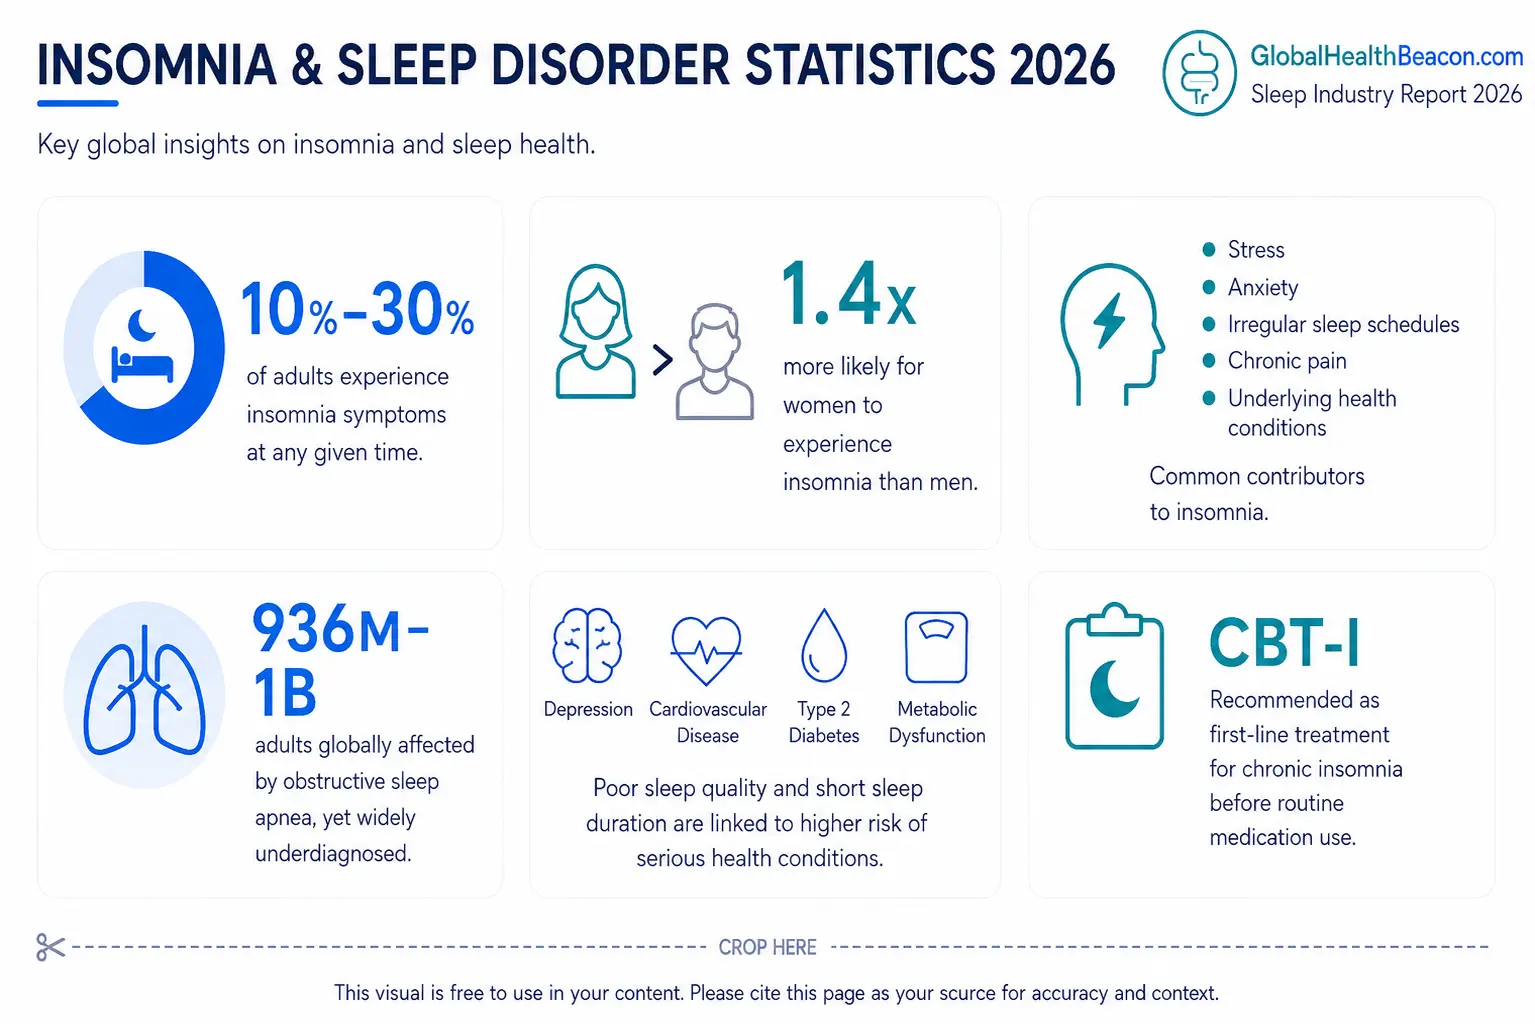
Insomnia & Sleep Disorder Statistics 2026
- 10%–30% of adults experience insomnia symptoms at any given time, making insomnia one of the most common sleep disorders worldwide¹
- Women are about 1.4× more likely than men to experience insomnia symptoms, with higher rates of sleep difficulty across multiple life stages²
- Stress, anxiety, irregular sleep schedules, chronic pain, and underlying health conditions are common contributors to insomnia symptoms³
- Obstructive sleep apnea affects an estimated 936 million to 1 billion adults globally, yet it remains widely underdiagnosed⁴
- Poor sleep quality and short sleep duration are associated with higher risk of depression, cardiovascular disease, type 2 diabetes, and metabolic dysfunction⁵
- Cognitive behavioral therapy for insomnia (CBT-I) is recommended as a first-line treatment for chronic insomnia before routine medication use⁶
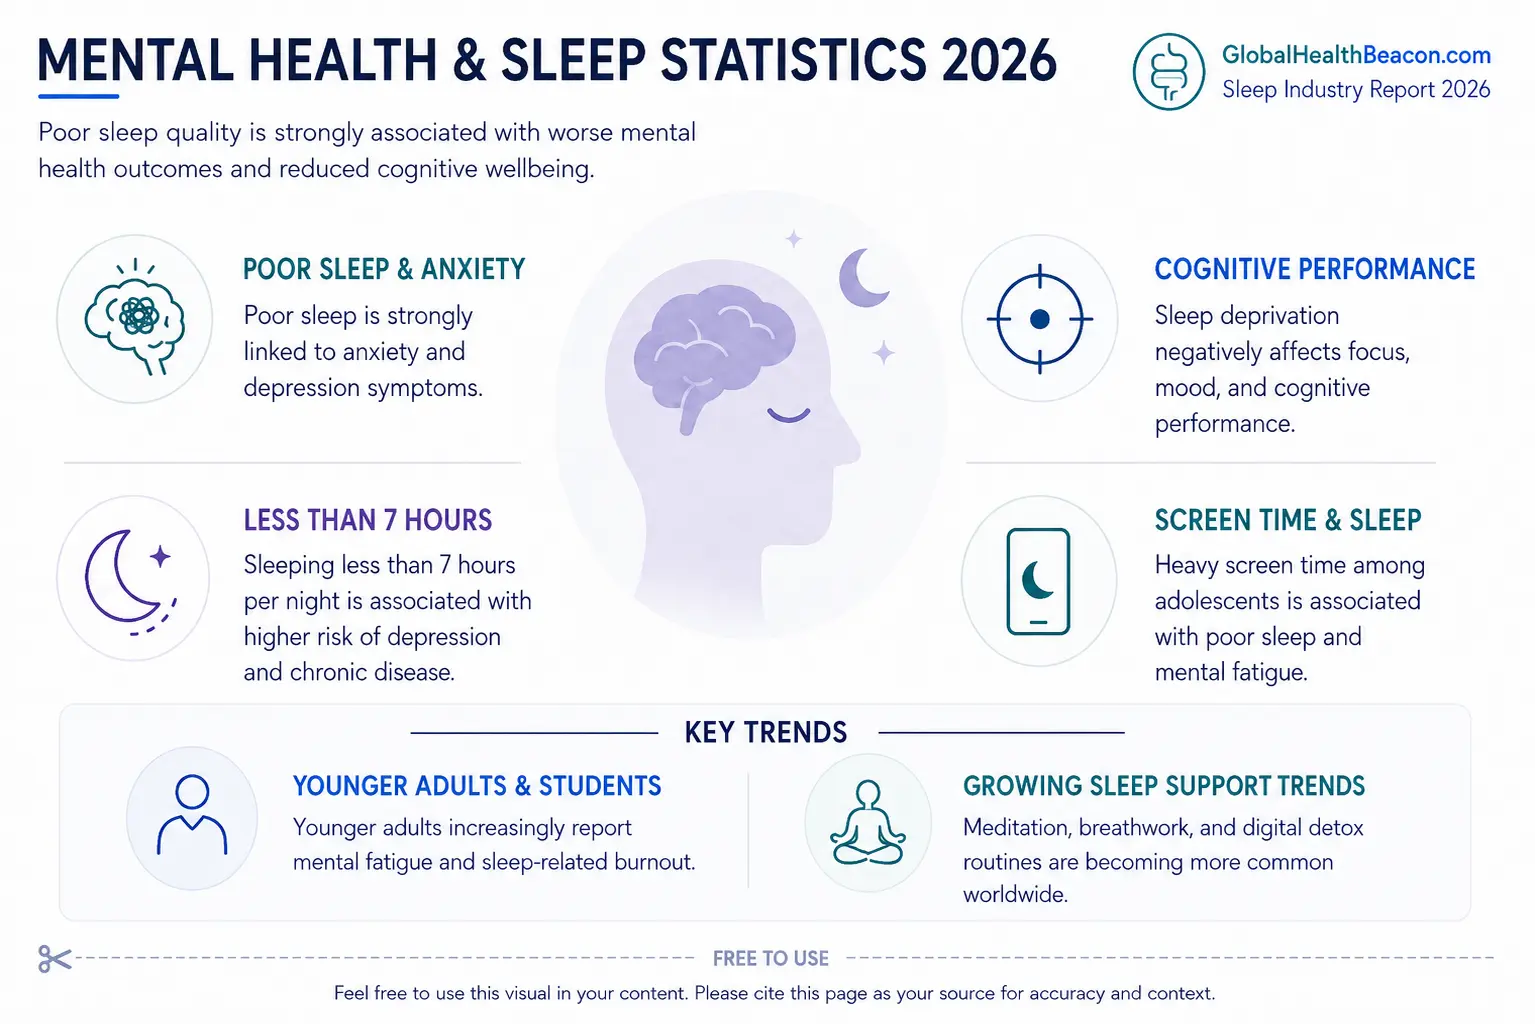
Mental Health & Sleep Statistics 2026
- Adults with insomnia are significantly more likely to experience anxiety and depression symptoms compared with adults without insomnia¹
- Sleeping less than 7 hours per night is associated with increased risk of depression, cardiovascular disease, obesity, and type 2 diabetes²
- Poor sleep quality is strongly linked to higher levels of psychological distress, emotional instability, and impaired daytime functioning³
- Sleep deprivation negatively affects emotional regulation, stress resilience, reaction time, and cognitive performance⁴
- Among adolescents, 4+ hours of daily screen time is associated with higher odds of anxiety and depression, partly linked to shorter sleep duration and irregular sleep schedules⁵
- Mental health experts increasingly recognize healthy sleep as a foundational pillar of psychological wellbeing alongside physical activity and stress management⁶
Sleep Technology & Wearable Statistics 2026
- 49 million wearable devices were shipped globally in Q2 2025, with smartwatches accounting for the largest share of the market¹
- More than 1 in 3 Americans have used sleep-tracking technology to monitor or improve their sleep habits²
- 77% of sleep tracker users say their device has helped them change their sleep behavior or daily routine²
- Smartwatches, rings, and fitness trackers increasingly measure sleep duration, recovery, heart rate variability, respiratory rate, and nighttime movement³
- AI-powered sleep coaching tools are becoming more common as sleep apps and wellness platforms personalize recommendations based on biometric data⁴
- Smart mattresses, temperature-regulated bedding, and connected bedroom devices are expanding the sleep economy beyond traditional wearables⁵
Sleep Optimization & Recovery Statistics 2026
- 7–9 hours of sleep per night remains the recommended range for most adults, making sleep duration one of the core foundations of recovery¹
- Consistent sleep and wake times are strongly linked to better sleep quality, circadian alignment, and daytime functioning²
- Evening routines that reduce bright light exposure, late caffeine intake, alcohol, and heavy meals can support healthier sleep timing and recovery³
- Athletes and high-performance communities increasingly track sleep duration, recovery scores, heart rate variability, and resting heart rate as core recovery metrics⁴
- Melatonin is widely used as a sleep-support supplement, but evidence and safety depend on dose, timing, age, medication use, and individual sleep problems⁵
- Sleep optimization is increasingly connected to longevity, metabolic health, cognitive performance, energy management, and emotional resilience⁶
The Sleep Economy & Consumer Trends 2026
- The sleep technology market is estimated at nearly $27 billion in 2025 and is expected to reach about $30.7 billion in 2026¹
- Sleep wearables are forecast to reach $32 billion by 2026, up from about $11 billion in 2019²
- Global sleep aids generated more than $5 billion in annual revenue, with herbal remedies, melatonin products, and non-prescription sleep support driving consumer demand³
- Insufficient sleep costs major economies billions of dollars each year through lost productivity, absenteeism, healthcare costs, and safety risks⁴
- Consumers increasingly treat sleep as part of performance, mental health, longevity, beauty, and recovery rather than only as a medical issue⁵
- AI, biometric tracking, smart mattresses, temperature-regulated bedding, and personalized sleep insights are expanding the sleep economy beyond traditional mattresses and supplements⁶
Explore Sleep Topics & Research Areas
How We Verified These Statistics
The statistics included in this report were compiled from peer-reviewed sleep research, PubMed-indexed studies, National Sleep Foundation reports, CDC sleep data, global consumer wellness surveys, and established healthcare and market research publications. Only statistics from publicly accessible or verifiable sources were included. Reported prevalence estimates, sleep behavior trends, and market projections may vary depending on population demographics, diagnostic criteria, geographic region, and study methodology. This report was last updated in May 2026.
How to Cite This Report
When referencing this report or its visuals, please cite Global Health Beacon – Sleep Industry Report 2026 as the original source.
Sources
This page is based on data from global health organizations, research institutions, and peer-reviewed studies.
- National Sleep Foundation
- PubMed (Peer-Reviewed Sleep Research)
- National Institutes of Health (NIH)
- American Academy of Sleep Medicine (AASM)
- Centers for Disease Control and Prevention (CDC Sleep Health)
- U.S. Food & Drug Administration (FDA)
- Grand View Research
- MarketsandMarkets Research
- Nature Publishing Group
- Scientific Reports Journal
- World Health Organization (WHO)
- Harvard Health Publishing
- Cleveland Clinic
