This report and its visuals are free to use in editorial content if you link to this page as the original source. Suggested source attribution: Global Health Beacon – Gut Health Industry Report 2026
Gut health is one of the fastest-growing areas in global healthcare. This page compiles the most relevant gut health statistics for 2026, including prevalence, trends, and industry data. All statistics are structured for quick reference and citation use.
Most Cited Gut Health Statistics
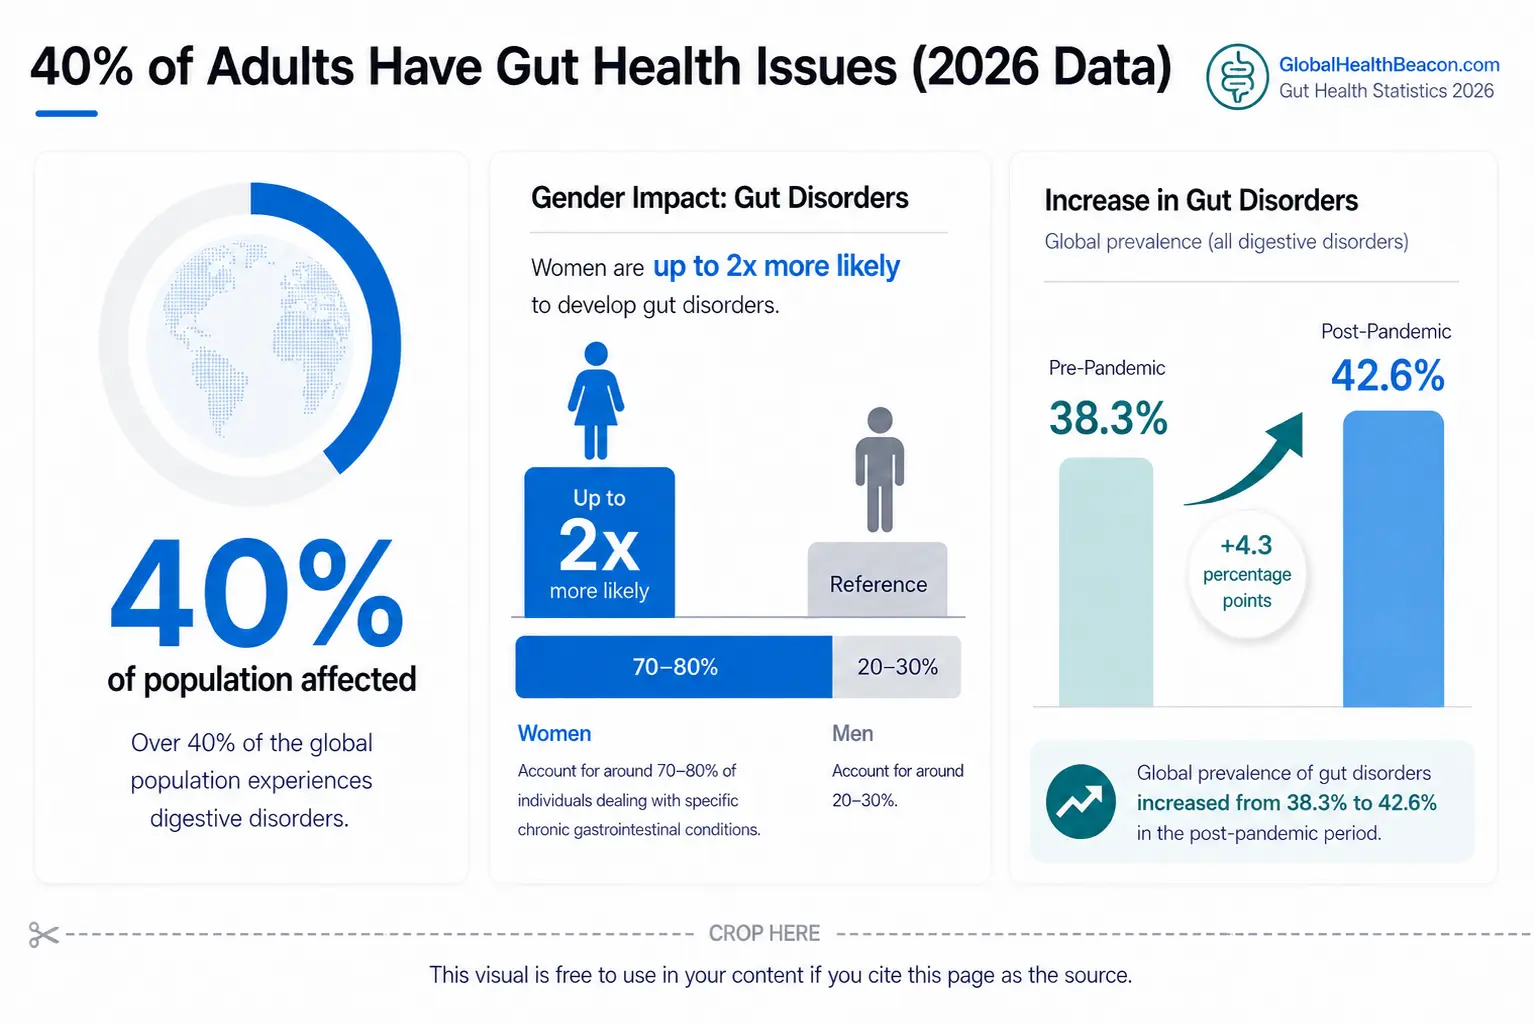
- 40%+ of adults globally meet criteria for at least one disorder of gut-brain interaction.
- Rome V introduced updated diagnostic criteria for irritable bowel syndrome (IBS) in 2026, refining the clinical definition of the disorder.
- Women are significantly more likely than men to report gut-brain interaction disorders.
- 84% of Americans report increased interest in gut health products and foods.
- The global probiotics market was estimated at approximately $76.6 billion in 2025.
Key Gut Health Statistics 2026
- 40%+ of adults globally meet criteria for at least one disorder of gut-brain interaction (DGBI)¹
- 42.6% post-pandemic DGBI prevalence vs 38.3% pre-pandemic²
- Rome V introduces updated IBS diagnostic criteria, including abdominal discomfort alongside pain and a lower symptom threshold for diagnosis³
- Trillions of microorganisms make up the human gut microbiome⁴
- Women are significantly more likely than men to meet DGBI diagnostic criteria globally⁵
- Younger populations report higher post-pandemic prevalence of disorders of gut-brain interaction⁶
IBS Statistics 2026
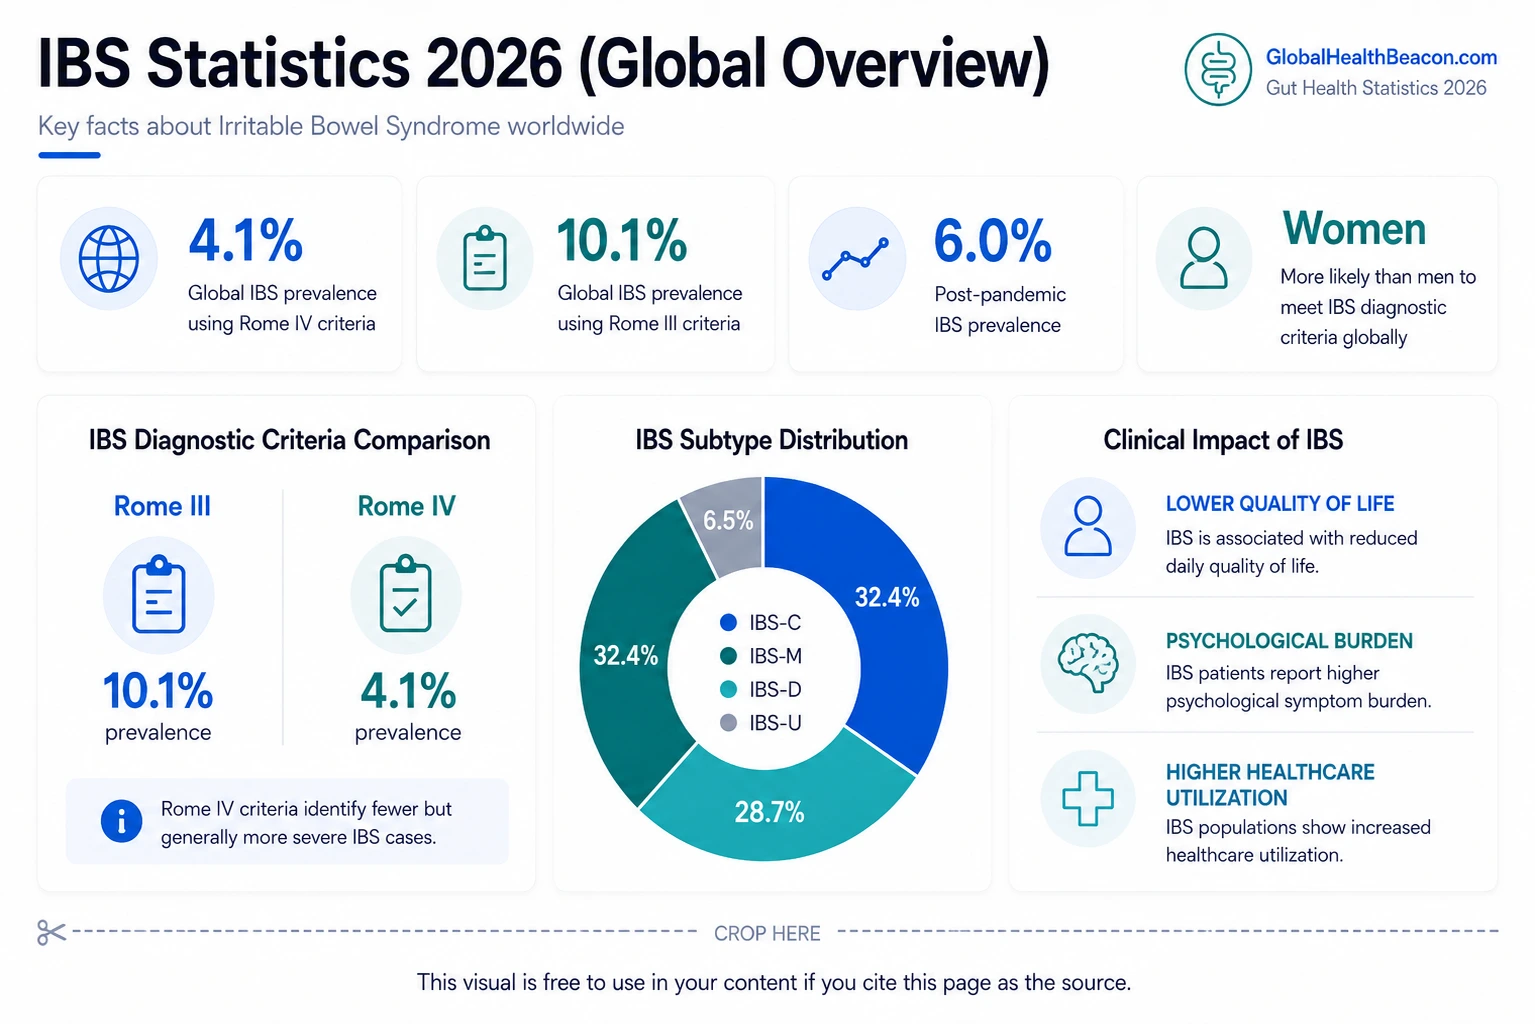
- Rome V reintroduces abdominal discomfort alongside pain in the diagnostic criteria for IBS¹
- Rome V lowers the IBS symptom threshold from 1 day per week (Rome IV) to an average of 3 days per month¹
- 6.0% post-pandemic IBS prevalence vs 4.7% pre-pandemic²
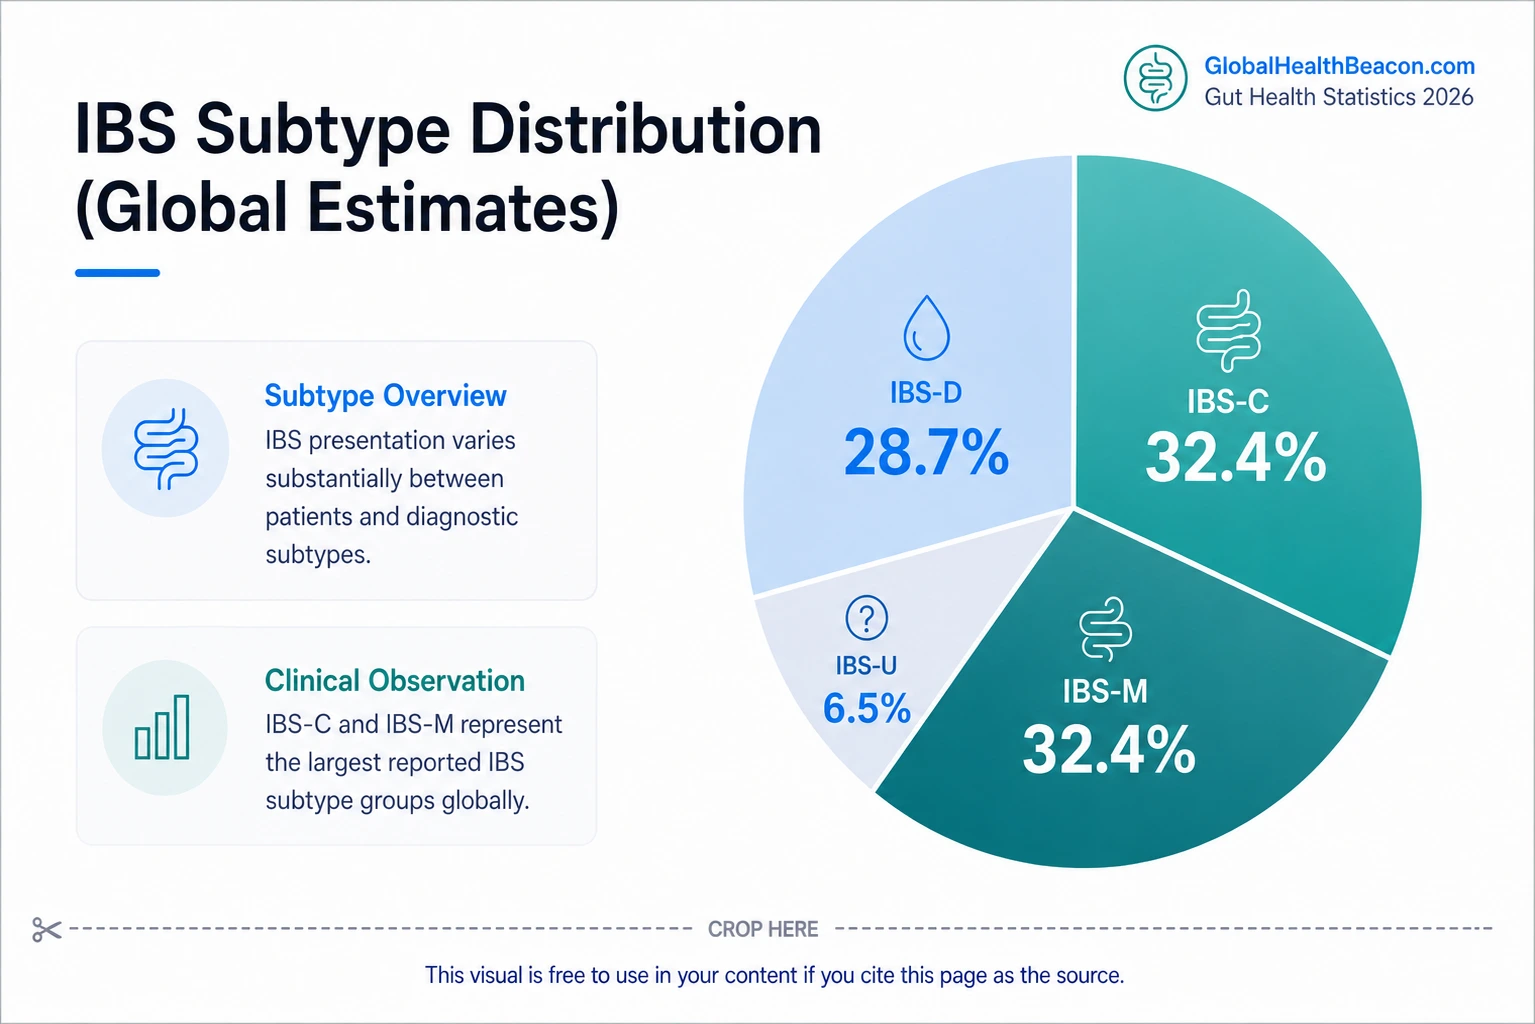
- 28.7% of IBS cases are diarrhea-predominant (IBS-D)³
- 32.4% of IBS cases are constipation-predominant (IBS-C)³
- 32.4% of IBS cases are mixed subtype (IBS-M)³
- 6.5% of IBS cases are unsubtyped (IBS-U)³
- Women are significantly more likely than men to meet IBS diagnostic criteria globally⁴
- IBS is associated with lower quality of life, higher psychological symptom burden, and increased healthcare utilization⁵
- Rome V distinguishes between clinical diagnostic criteria and research diagnostic criteria, improving flexibility for patient care¹
Bloating Statistics 2026
- 19% global prevalence of bloating symptoms¹
- 9% of adults report visible abdominal distension¹
- 18% of adults experience bloating symptoms at least weekly²
- 66%–90% of IBS patients report bloating symptoms³
- Up to 60% of functional dyspepsia patients report bloating³
- Bloating is among the most commonly reported gastrointestinal symptoms worldwide⁴
Functional Dyspepsia Statistics 2026
- 8.4% global prevalence of functional dyspepsia¹
- 6.8% prevalence using the latest pre-Rome V diagnostic criteria¹
- 11.9% prevalence reported using Rome I criteria¹
- Women report significantly higher functional dyspepsia prevalence than men¹
- Functional dyspepsia prevalence has gradually decreased from 12.4% (1990–2002) to 7.3% (2013–2020)¹
- Functional dyspepsia prevalence varies substantially across countries, populations, and diagnostic criteria¹
Constipation Statistics 2026
- 7.4% global prevalence of functional constipation using the latest pre-Rome V diagnostic criteria¹
- Functional constipation prevalence varies substantially across regions, populations, and diagnostic definitions²
- Functional constipation remains one of the most common disorders of gut-brain interaction globally³
- Older age is associated with higher functional constipation prevalence compared with other DGBIs⁴
Gut-Brain Axis Statistics 2026
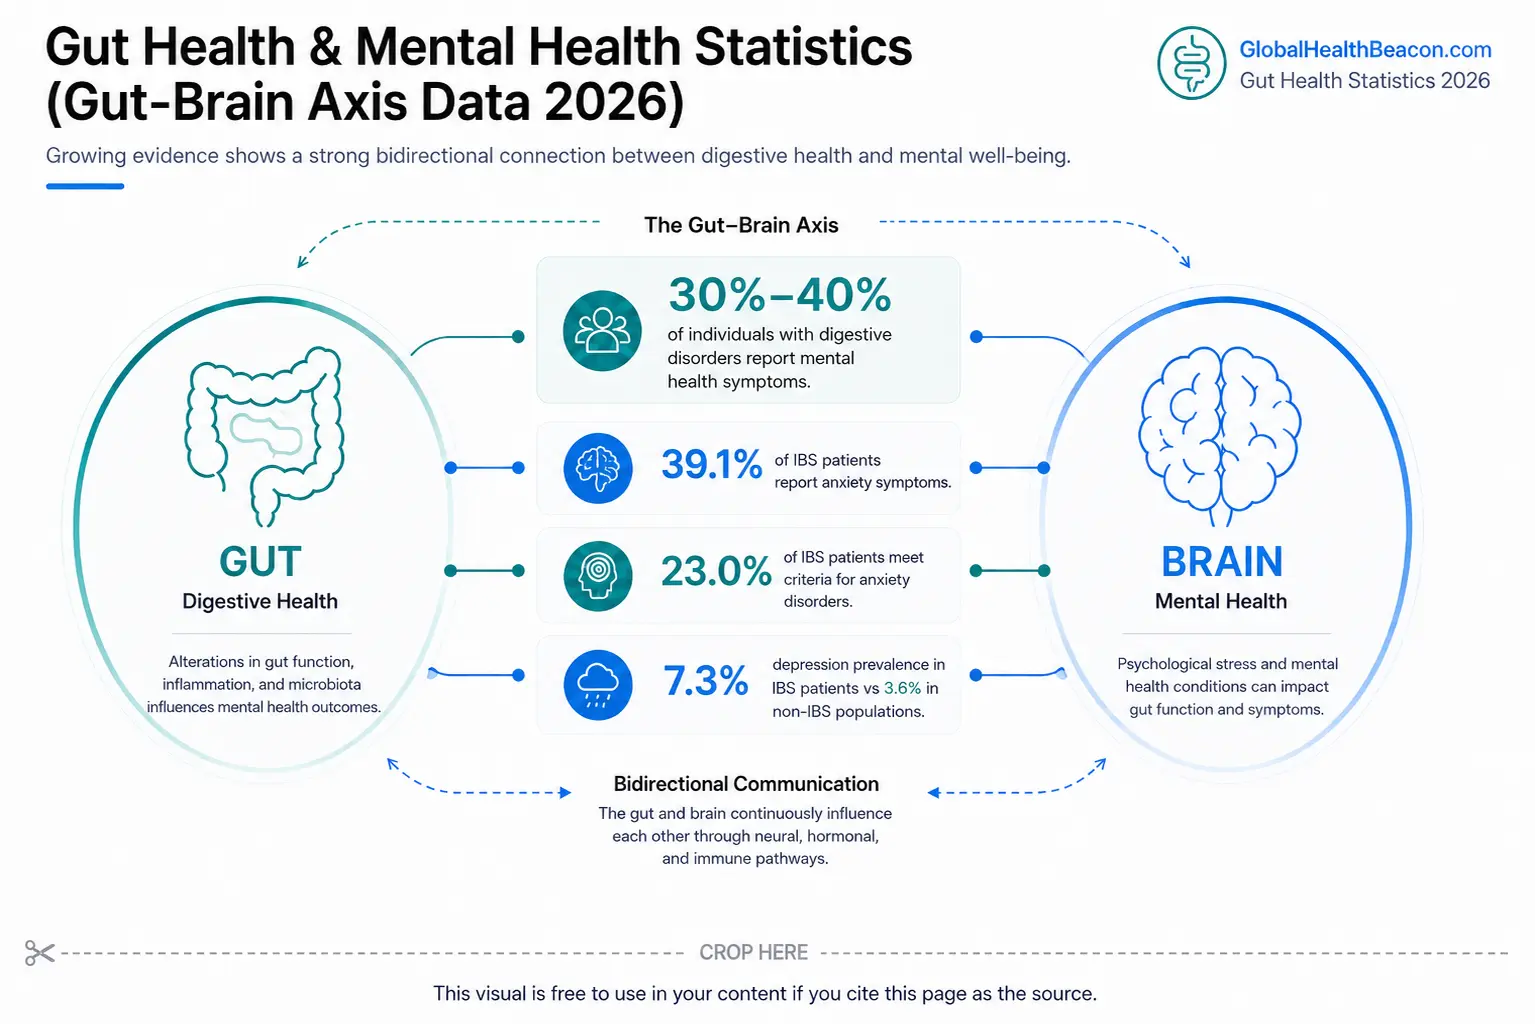
- 39.1% of IBS patients report anxiety symptoms¹
- 23.0% of IBS patients meet criteria for anxiety disorders¹
- 3.11x higher odds of anxiety symptoms in IBS patients vs healthy controls¹
- 2.52x higher odds of anxiety disorders in IBS patients vs healthy controls¹
- 28.8% of IBS patients report depressive symptoms¹
- 23.3% of IBS patients meet criteria for depressive disorders¹
- 3.04x higher odds of depressive symptoms in IBS patients vs controls¹
- 2.72x higher odds of depressive disorders in IBS patients vs controls¹
- 7.3% depression prevalence reported in IBS populations vs 3.6% in non-IBS populations²
- 23.3% of DGBI populations report moderate-to-severe psychological distress vs 7.4% without DGBI³
- 12.4% of DGBI populations report high somatic symptom severity vs 2.1% in non-DGBI controls³
IBS Quality of Life Statistics
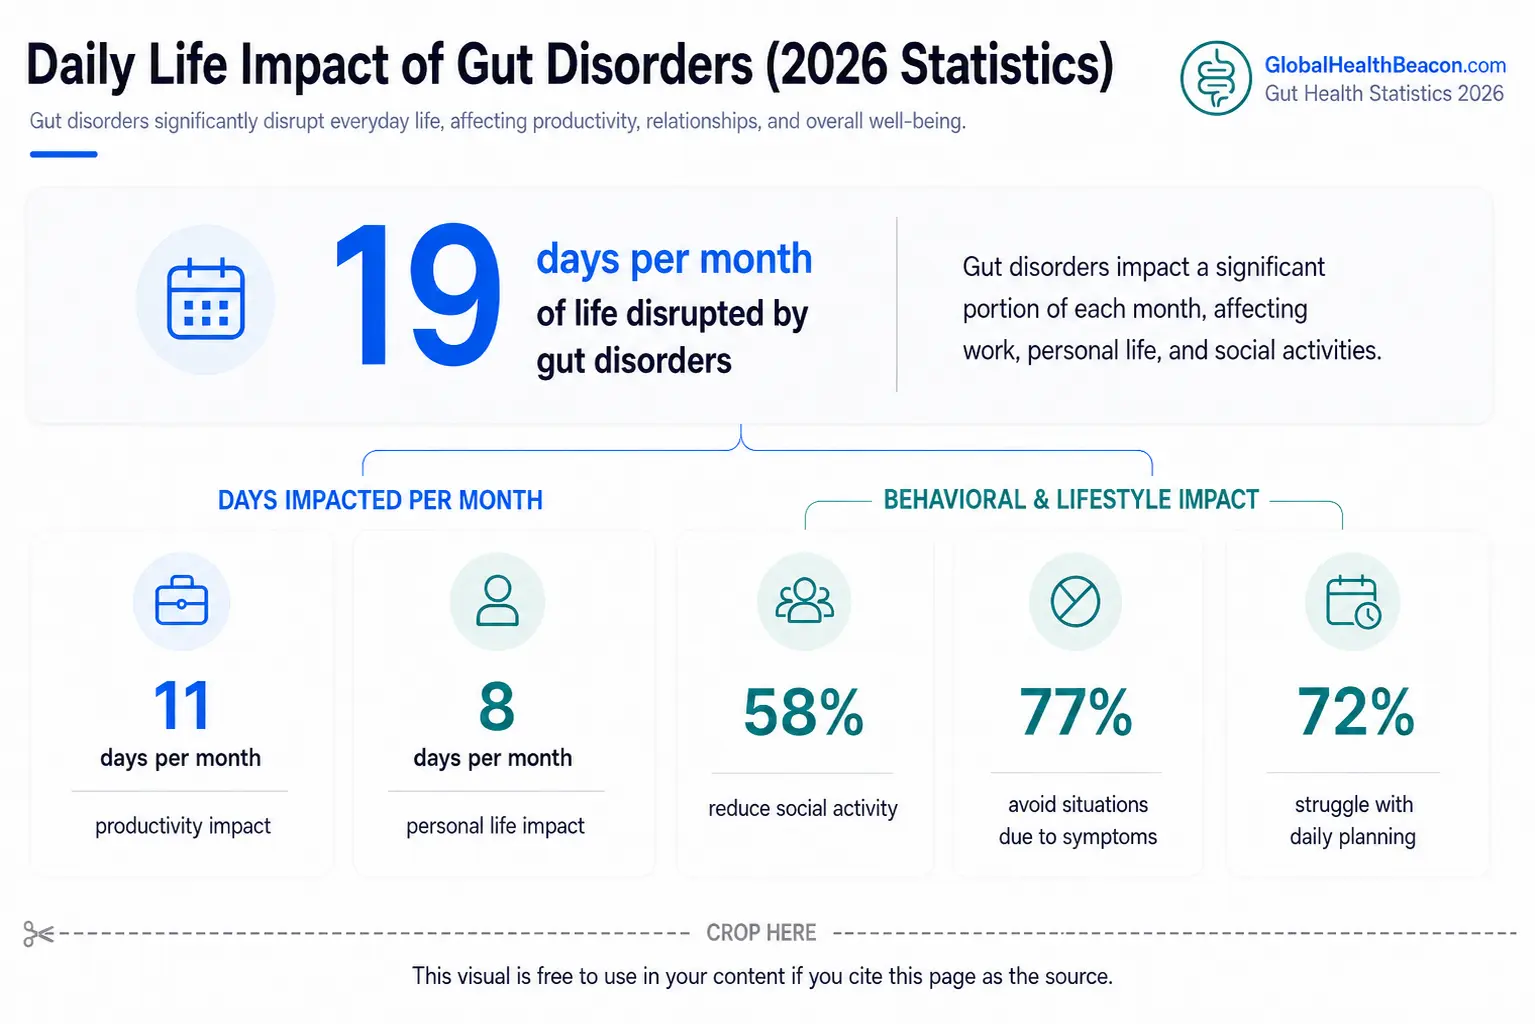
- IBS symptoms disrupt daily life an average of 19 days per month¹
- 11 days per month of work or school productivity affected by IBS symptoms¹
- 8 days per month of personal activities impacted by IBS symptoms¹
- Missed work or school days increased from 2.1 to 3.6 days per month between 2015 and 2024¹
- 58% of IBS patients reduce time spent with friends and family because of symptoms¹
- 77% of IBS patients avoid situations with limited toilet access¹
- 72% of IBS patients struggle to plan activities because of symptom unpredictability¹
- 72% of IBS patients report staying home more often because of symptoms¹
- Individuals with multiple disorders of gut-brain interaction (DGBIs) report substantially lower quality of life compared with single-disorder populations²
- DGBI populations experience significantly higher work productivity impairment compared with non-DGBI controls²
Gut Health Consumer Statistics
- 99% of Italian consumers have heard of the term “gut flora”¹
- 78% of Italian consumers have heard of the term “microbiota”¹
- 77% of Italian consumers are familiar with prebiotics¹
- 27% of Americans report knowing exactly what the term “gut microbiome” means²
- 61% of Americans say they know exactly what probiotics are²
- 84% of Americans report increased interest in gut health products and foods³
- 51% of global consumers report strong interest in the gut microbiome⁴
- 55% of consumers actively choose products that support digestive health⁴
- Consumer interest in microbiome testing continues to rise despite ongoing concerns about clinical reliability⁵
Gut Health Market Size Statistics
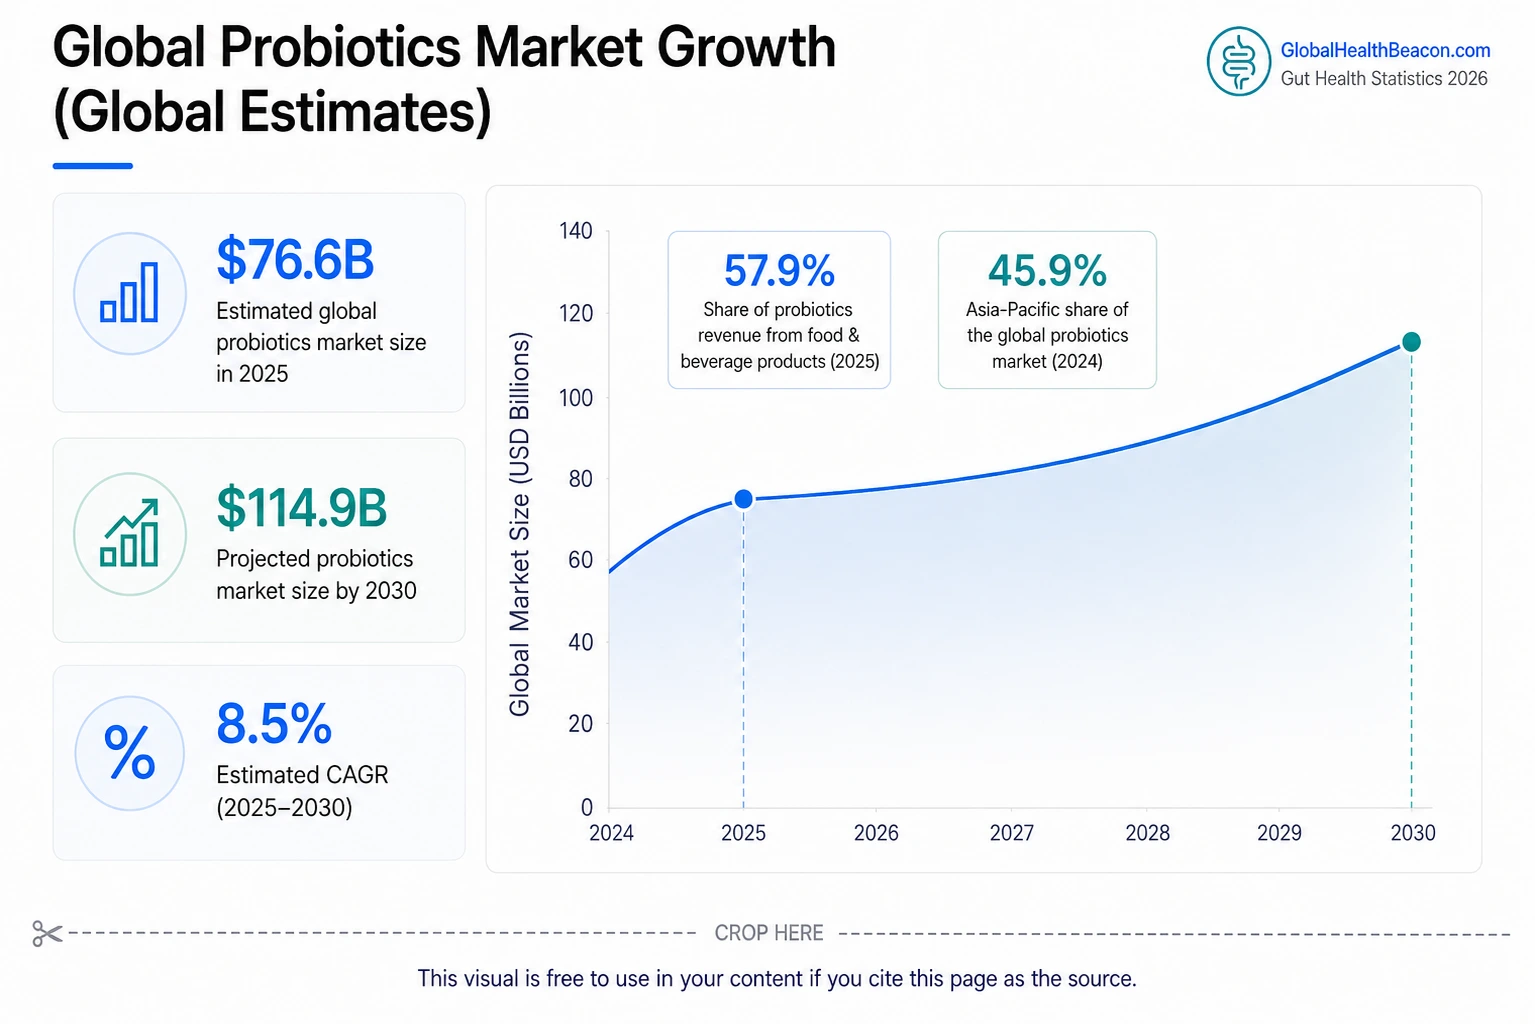
- The global probiotics market was estimated at approximately $76.59 billion in 2025 and is projected to reach around $114.95 billion by 2030 at an estimated CAGR of 8.5%¹
- Alternative market analyses project the global probiotics market could exceed $300 billion by 2033, reflecting major differences in category scope and methodology between research firms²
- Probiotic food and beverage products accounted for approximately 57.9% of total probiotics market revenue in 2025²
- Asia-Pacific represented approximately 45.9% of the global probiotics market in 2024 and remains the dominant regional market¹
- Rising consumer demand for digestive health, microbiome support, and preventive wellness continues to drive long-term growth across probiotics, functional foods, and gut health supplements³
Microbiome Testing Statistics
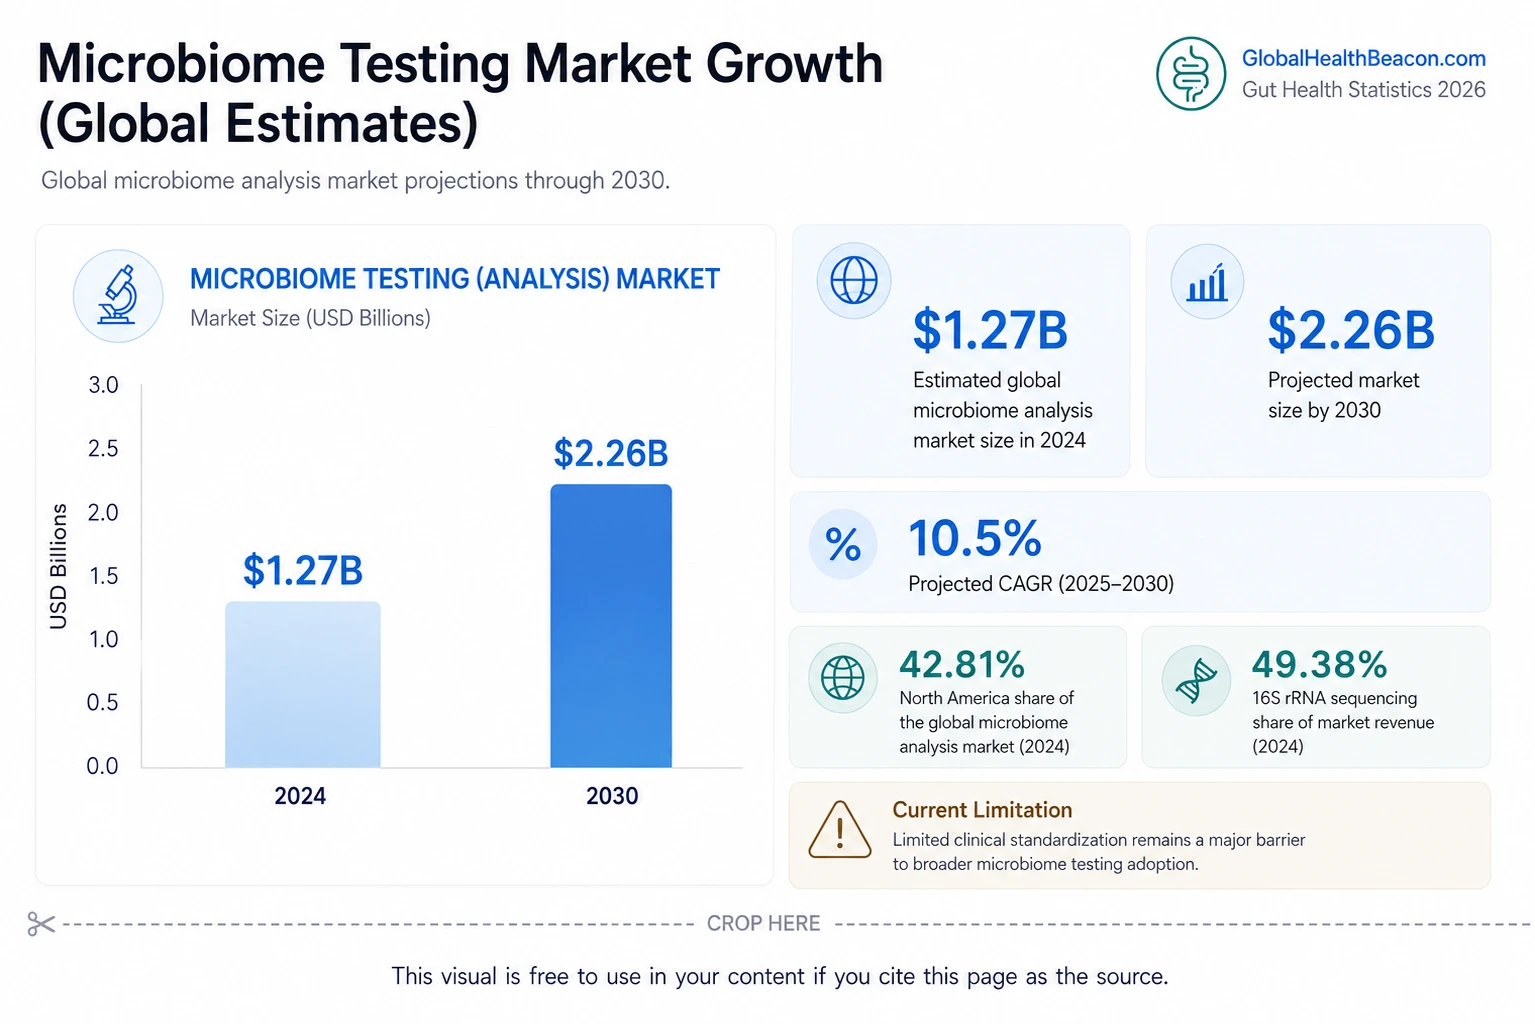
- $1.27B global microbiome analysis market size in 2024¹
- $2.26B projected microbiome analysis market size by 2030¹
- 10.47% projected CAGR for the microbiome analysis market between 2025–2030¹
- North America accounted for 42.81% of the global microbiome analysis market in 2024¹
- 16S rRNA sequencing represented 49.38% of microbiome analysis market revenue in 2024¹
- Significant inconsistencies have been reported across microbiome testing providers regarding bacterial classification and result interpretation²
- Limited clinical standardization remains one of the largest barriers to widespread microbiome testing adoption¹
Gut Health Trends 2026–2030
- FDA approval of Rebyota (2022) and Vowst (2023) marked the first major regulatory approvals of microbiome-based therapeutics¹
- Vowst became the first orally administered FDA-approved microbiome therapy in 2023²
- Precision nutrition based on microbiome and metabolomic data continues to expand rapidly across healthcare and consumer wellness markets³
- AI-driven microbiome diagnostics and multi-omics analysis are accelerating microbiome research capabilities⁴
- Multi-omics integration is becoming a major focus in microbiome and probiotics research⁵
- Lack of standardization and reproducibility remains one of the largest limitations in commercial microbiome testing⁶
- Clinical validation continues to be a major barrier to large-scale microbiome therapeutics adoption⁶
- More than 3,600 scientific publications related to probiotics were indexed between 2000–2025⁷
Explore Gut Health Topics & Research Areas

How We Verified These Statistics
The statistics included in this report were compiled from peer-reviewed medical journals, PubMed-indexed studies, Rome Foundation global epidemiology research, FDA publications, large-scale consumer surveys, and established market research reports. Only statistics from publicly accessible or verifiable sources were included. Reported prevalence estimates and market projections may vary depending on diagnostic criteria, geographic region, study methodology, and survey population. This report was last updated in May 2026.
How to Cite This Report
When referencing this report or its visuals, please cite Global Health Beacon – Gut Health Industry Report 2026 as the original source.
Sources
This page is based on data from global health organizations, research institutions, and peer-reviewed studies.
- Rome Foundation Global Epidemiology Studies
- PubMed (Peer-Reviewed Medical Research)
- National Institutes of Health (NIH)
- American Gastroenterological Association (AGA)
- U.S. Food & Drug Administration (FDA)
- Grand View Research
- MarketsandMarkets Research
- Nature Publishing Group
- Scientific Reports Journal
- Biocodex Microbiota Institute
- World Health Organization (WHO)
- Harvard Health Publishing
- Cleveland Clinic
