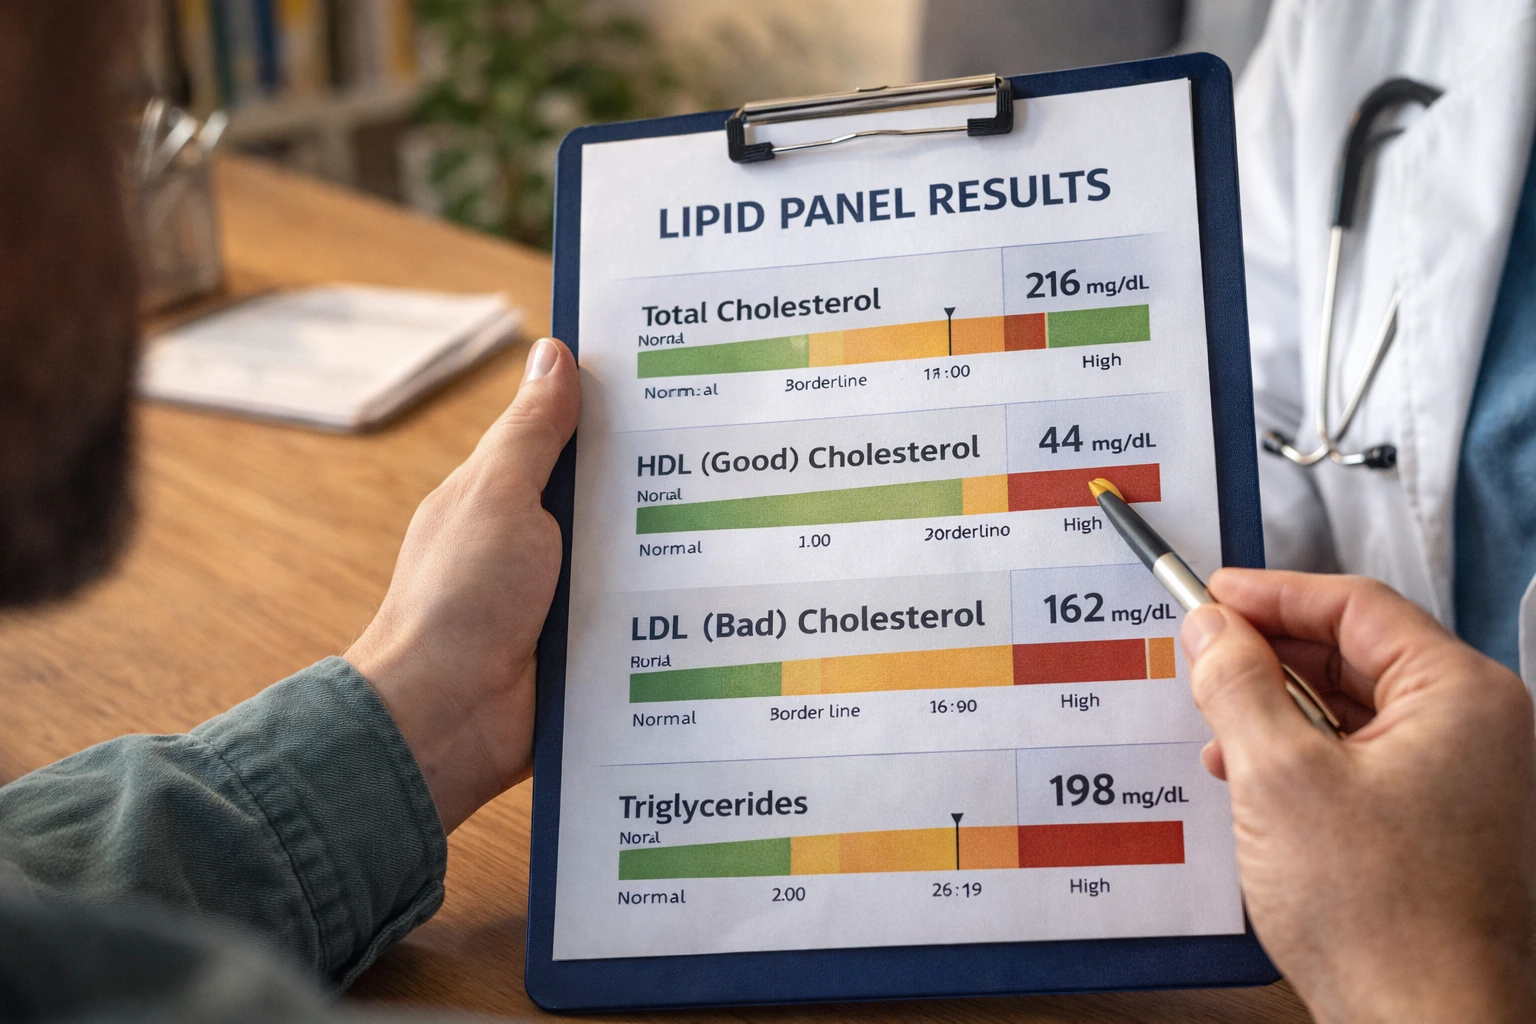
You get your lab results back and stare at numbers like LDL, HDL, and triglycerides, wondering what they actually mean for your body and your future, so let’s break down lipid panel results explained in a way that finally makes sense.
The basics of lipids
Lipids are essential fats that your body manufactures and obtains from food, serving as building blocks for cell membranes, insulation for nerves, and raw material for hormone synthesis. Think of lipids as your body’s construction workers and energy suppliers rolled into one. Without them, your cells couldn’t maintain their structure, your brain couldn’t function properly, and your body couldn’t produce the estrogen and progesterone that regulate your menstrual cycle and bone health. There are several types of lipids circulating in your bloodstream right now. Cholesterol gets the most attention, but triglycerides matter equally. Your liver manufactures cholesterol daily, and you also absorb it from animal products like eggs, dairy, and meat. The balance between how much your body makes and how much you consume determines your overall lipid profile. Understanding these distinctions helps you grasp why your doctor ordered a lipid panel and what those numbers actually represent about your cardiovascular and metabolic health.
Cholesterol demystified
Cholesterol itself isn’t inherently bad. Your body needs it to build cell membranes, synthesize vitamin D, and produce steroid hormones. The problem emerges when cholesterol levels become imbalanced. LDL cholesterol, often called bad cholesterol, carries cholesterol from your liver to cells throughout your body. When LDL levels stay elevated, particles accumulate inside artery walls, forming plaques that narrow blood vessels and restrict blood flow. This process, called atherosclerosis, develops silently over years without symptoms. HDL cholesterol works like a cleanup crew, picking up excess cholesterol from your arteries and tissues, transporting it back to your liver for disposal. Women typically have naturally higher HDL levels than men before menopause due to estrogen’s protective effects. After menopause, HDL tends to decline and LDL may rise, shifting cardiovascular risk. This is why monitoring your lipid panel becomes increasingly important as you age. The ratio between these two types tells a more complete story than either number alone.
Interpreting your results
Your lipid panel report contains five key measurements that paint a picture of your cardiovascular health. Total cholesterol combines all cholesterol types in your blood; under 200 mg/dL is generally considered desirable, though context matters. LDL cholesterol ideally stays below 100 mg/dL, with levels between 100 and 129 acceptable for most women, but those with existing heart disease or multiple risk factors may need lower targets. HDL cholesterol above 60 mg/dL offers protective benefits, and higher is better here. Triglycerides, measured in fasting blood, should stay below 150 mg/dL; elevated levels above 200 mg/dL signal increased cardiovascular and metabolic risk. Your doctor may also calculate the total cholesterol to HDL ratio by dividing total cholesterol by HDL; a ratio below 5 is favorable. For example, a woman with total cholesterol of 210, LDL of 130, HDL of 50, and triglycerides of 180 would have a ratio of 4.2, which appears reasonable numerically but reveals concerning patterns. Her HDL is low, triglycerides are elevated, and LDL is borderline high, suggesting metabolic stress despite the acceptable ratio. This illustrates why looking at individual values and patterns matters more than any single number.
- Request your actual lab report from your healthcare provider and ask for the reference ranges used by your specific laboratory, as ranges can vary slightly between facilities.
- Write down each value and compare it to the normal ranges provided, noting which results fall outside the desirable zone and by how much.
- Calculate your total cholesterol to HDL ratio by dividing total cholesterol by HDL to gain additional insight into your cardiovascular risk profile.
- Schedule a follow-up conversation with your doctor to discuss what your specific numbers mean in the context of your personal health history, family history, and current lifestyle.
- Ask your healthcare provider whether your results warrant dietary changes, increased physical activity, medication, or simply continued monitoring at your next annual checkup.
🔬 Science-backed benefits in 2 minuteschoose where to begin:
Factors influencing lipid levels
Your lipid profile isn’t fixed. It responds dynamically to genetics, diet, exercise, stress, sleep quality, hormonal status, and overall health conditions. Genetics load the gun, but lifestyle pulls the trigger. If your mother and grandmother both had high cholesterol, your body likely has a stronger tendency to produce LDL cholesterol, but this doesn’t guarantee high levels. A woman eating a diet rich in saturated fats and trans fats will see LDL rise, while one consuming abundant fiber, plant sterols, and omega-3 fatty acids may see it drop significantly. Regular aerobic exercise increases HDL and lowers triglycerides within weeks. Excess weight, particularly around the abdomen, correlates with higher triglycerides and lower HDL. Chronic stress elevates cortisol, which can increase cholesterol production. Poor sleep disrupts hormones that regulate appetite and metabolism, often raising triglycerides. Menopause itself shifts lipid patterns as estrogen declines. Thyroid disorders, diabetes, and kidney disease all influence lipid metabolism. Understanding these connections empowers you to identify which factors you can modify and which require medical attention.
Importance of regular monitoring
A single lipid panel snapshot provides limited information. Your lipid levels fluctuate based on diet, stress, illness, and hormonal cycles. Getting tested every four to six years if results are normal, or annually if they’re borderline or elevated, allows you and your doctor to spot trends. Imagine a woman whose total cholesterol creeps up from 190 to 210 to 235 over three years. That gradual climb signals metabolic changes that warrant intervention before a heart attack or stroke occurs. Regular monitoring also reveals how your body responds to lifestyle changes. If you start exercising consistently and eating more plant-based foods, retesting in eight to twelve weeks shows whether your efforts are working. For women on cholesterol-lowering medication, periodic testing ensures your dose remains appropriate. Monitoring becomes especially critical after menopause, during high-stress periods, after significant weight gain or loss, and when new health conditions develop. Your lipid panel is like a vital sign for your cardiovascular system. Checking it regularly is preventive medicine at its finest, catching problems early when interventions are most effective.
Conclusion
Your lipid panel results represent more than numbers on a lab report. They reflect the cumulative effects of your genetics, daily choices, stress levels, sleep quality, and overall health status. Understanding what cholesterol and triglycerides do in your body, recognizing what your specific results mean, and identifying which factors you can influence puts you in the driver’s seat of your cardiovascular health. This knowledge transforms a confusing medical report into actionable information. Working with your healthcare provider to interpret your results in context of your personal risk factors, family history, and life stage ensures you receive guidance tailored to your situation, not generic recommendations. Whether your results indicate you’re thriving, need lifestyle adjustments, or require medication, you now have the foundation to make informed decisions. Your heart has been beating faithfully your entire life. Regular lipid monitoring and proactive management honor that commitment by reducing your risk of cardiovascular disease and supporting decades of healthy living ahead.
Understanding your lipid panel results empowers you to take charge of your cardiovascular health. By grasping how lipids function in your body, interpreting your specific numbers with professional guidance, recognizing the lifestyle factors you can control, and committing to regular monitoring, you transform abstract lab values into a personalized roadmap for heart health and longevity.
What are normal ranges for lipid panel results in women?
Normal lipid ranges for women include total cholesterol under 200 mg/dL, LDL cholesterol below 100 mg/dL (optimal is below 70 for those with existing heart disease), HDL cholesterol above 60 mg/dL (higher is better), and triglycerides below 150 mg/dL. However, individual targets vary based on age, menopause status, family history, and existing health conditions. Always discuss your personal target ranges with your healthcare provider.
How can lifestyle changes impact lipid levels?
Lifestyle modifications can significantly shift lipid profiles within weeks to months. A heart-healthy diet emphasizing fiber, plant sterols, omega-3 fatty acids, and limiting saturated and trans fats lowers LDL and triglycerides while raising HDL. Regular aerobic exercise increases HDL and reduces triglycerides. Maintaining a healthy weight, managing stress through meditation or yoga, improving sleep quality, and avoiding smoking all contribute to healthier lipid levels. These changes often work synergistically, producing greater benefits than any single intervention alone.
Others also read:
Disclaimer: This article is for informational purposes only and is not a substitute for professional medical advice. Always consult a healthcare professional for personal guidance.
This article has been prepared and reviewed by the GlobalHealthBeacon editorial team and is based on current medical research and published scientific literature available in 2026. It provides structured, evidence-based information to support informed health decisions.
